Selecting Production Parameters to Ensure that Picture Quality Accommodates the Intended and Possible Future Imaging Systems
David Corley – Moss Scott – David Adams
Abstract
For many years there has been an emphasis on increasing dynamic range and color saturation in television and, to an even greater extent, in digital cinema. This begs the question; just how much data do we really need to record and store? An epic motion picture to be shown on a 20 m screen at 3000:1 contrast ratio could justify the ultimate image quality, but this could be overkill for a daily breakfast show typically viewed in a kitchen. This paper discusses aspects of studio production and image quality with regard to present day imagers and current market trends.
Image Quality – an Historical Perspective
Since the development of the earliest moving pictures over 100 years ago, picture quality in film and, more recently, electronic images, has continued to improve. Five elements control the quality of the image; the camera or imager, the scene, the recording medium, the distribution system and the display device. While there always has to be a weakest link, by and large during this period, the various elements have improved at approximately the same rate.
There have always been industrial and home versions of the current system; when 35mm film was king, we also had 16 and 8mm. Then 35mm expanded to Cinerama, VistaVision and IMAX. At each level of improvement, the human eye was able to see the difference. Now, it can be argued that digital and film imaging have attained a level where little is to be gained by improving image quality further as the human eye will no longer be able to discern the improvement.
With Limited Bandwidth, Less can be more
As the demand for greater selection in programming escalates, we are in danger of substituting quantity for quality. Inferior image quality has been reported by viewers when comparing cable, internet or satellite feeds with the same program being simulcast over-the-air (OTA). My learned colleagues hope to demonstrate that attractive pictures can be produced when working within limitations of compression, bandwidth, dynamic range and existing color gamut.
Not a New Concept
Adjusting production techniques to produce the best looking image possible within the confines of a system makes considerable sense and has been practiced by film producers throughout the past century. A classic example was in the early 1900s when the only motion picture film available was orthochromatic (insensitive to red light). This resulted in darker than natural skin tones, with lips looking black. The solution was to use green make-up on the actors’ faces and hands.
But what to do when the ultimate distribution medium is not known or the production is a large screen motion picture also being distributed on disk, but ultimately being compressed, say for cable use?
The Answer is "Control"
By control we mean using every bit and byte of the image intelligently and not to waste data recording tones or colours that will not be displayed. In the heat of production, this is easier said than done. The directors of photography, engineers and technicians who consistently produce the best looking images do so by controlling every technical aspect of image quality.
Yusuf Karsh, renowned for his famous portraits of Winston Churchill and others was asked by a student, “How many f-stops do you bracket when shooting celebrities?” Karsh replied, “I never bracket, every picture is technically perfect, and any additional shots are strictly for different facial expressions”.
Reference Test Targets
The easiest and most reliable way to control image quality is to use precision reference test materials. Accurate test charts that produce meaningful data can be invaluable, but beware of obsolete or inaccurate test materials. It is far preferable to use a camera with factory setup than to align a camera using old or inaccurate test charts
Similarly, white balancing to any old piece of paper is another recipe for poor image quality. For consistent, meaningful results, white balancing cards should be spectrophotometrically neutral.
Know Your Test Chart Characteristics
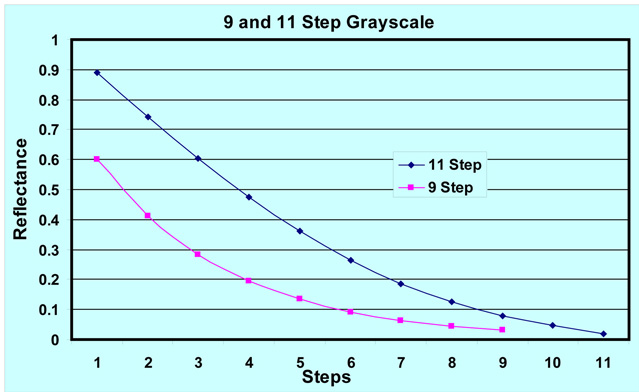
Another issue of concern is test materials that look alike, but intentionally have different characteristics. There are nine-step crossed staircase charts with the lightest chip at 60% reflection and similar looking charts with a white chip at 90% reflection. There are nine-step charts with linear greyscales and others that are logarithmic; the same thing applies to 11-step and 13-step. (Figure 1)
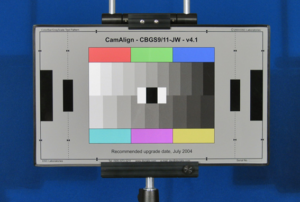
These differences have been a constant concern over the past 30 years, although the past five years have been a period of relative stability. The industry seemed to have standardised on the 11-step greyscale with 85% white level designed to produce a linear waveform at 0.45 Gamma.
Recently however, because so many film technicians are going digital, there has been an increasing demand for logarithmic charts. This is to be expected because the film community is used to working in f-stops not mV. The answer to this confusion is to understand the differences, to use current, reputable test materials and to use the type most suited to a particular application. (Figure 2)
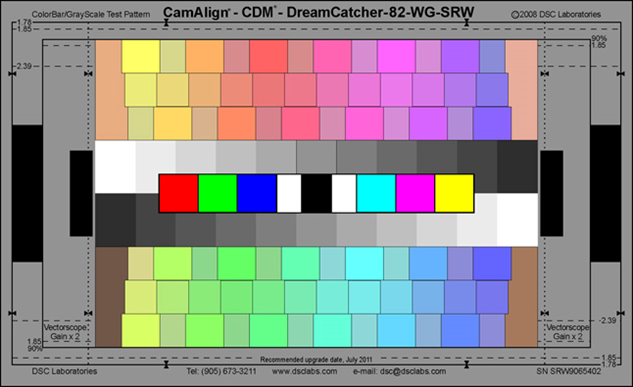
The increasing interest in the new extended colour gamut cameras has led to the design of a patented combination front/rear lit chart. (Figure 3)
A Different Approach
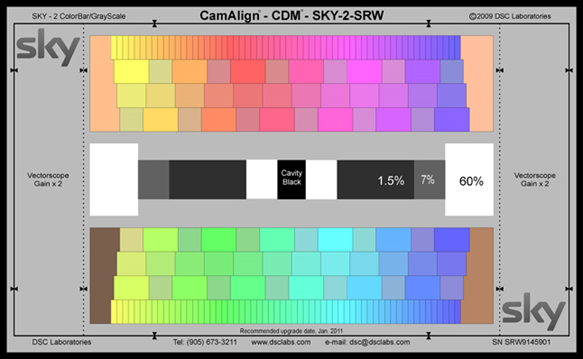
Imagine my consternation when our friends in the UK phoned wanting a totally different test target, but still having many of the characteristics of an existing pattern. Instead of the normal 85-90%, they wanted a 60% white, with over 150 precision colours, but no crossed greyscale (Figure 4). I figured – that’s all the industry needs, yet another standard. I tried to talk them out of it, but they persisted and the longer they talked, the more sense it made. They convinced me and they may well convince you.
Five Aspects of Program Making
Five aspects of production need to be reconciled with bandwidth and quality:
- Creating the set and storyboard
- Acquiring the content
- Production workflow
- Distributing the Program
- Archive Storage
Program creators need normal colour vision, a thorough grasp of colorimetry and a properly controlled working ambience of lighting and graphics stations to transform ideas into wood, metal, fabric and paint. Studios use artificial lighting but the television viewer sees the product as if in “standard” daylight amidst all the distractions of an everyday home, a point not to be forgotten by us all.
Top-end cameras are sharp in resolution and colourful, but they are not free from video noise nor are they cool-running. All camera signal processing imposes a form of filtering on the off-chip video to a greater or lesser degree. It is quite possible for 32-bit processing in the camera head but bandwidth constraints within the TV station usually decree distribution as 10-bit 4:2:2 and compression doesn’t stop there.
Within the production workflow there is competition for server ports, disk space and editing. The video signal data-stream can be further reduced for example to 8-bit 4:2:0 with due attention to SMPTE/ITU specifications such as Rec. 709. Papers such as “Video Compression Standards for Broadband Video Services” by Lee & Kalva [ISBN-13 978-0-387-71042-6] are also informative. Even more care is needed with 3:1:1 formats and the possibly greater compression used in streamed media
There are probably only three digital distribution methods – Terrestrial, Satellite and Cable/Streamed Media. Satellite distribution offers many channels of sufficiently noise-free high quality at all points of compression in the delivery chain. It is this that ultimately leads to a higher bandwidth (bitrate) quality threshold and thus the potential to deliver cost benefits of more channels at a predetermined quality.
Finally, how to manage the archive? Is it the finished product or an un-edited original with the edit decision lists? Once material is locked into an inferior standard, retrieval without loss is impossible.
HD Camera Capture Technology
Present and future imagers possess the sensitivity and resolution for 720p, 1080i and 1080p, [SMPTE 292M, 372M, 424M] but they vary in colorimetry and signal-to-noise performance. Gamma pre-correction of the video signal is a historical artifice to compensate for the display characteristics, but it remains useful as a noise-reduction tool and can enhance both contrast and saturation. Figure 5 shows a sine-wave zone plate and Figure 6 the Rec. 709 gamma transfer law which is generally accepted in production. However, camera manufacturers also offer a number of modifiers to this law and display manufacturers are well aware that overall non-linearity can enhance or extend the contrast and colourfulness of the final display. Colour space development such as “xvYCC” is always ongoing with lively input from the Consumer Electronics group.
There are three families of sensor, namely CCDs, photodiodes and CMOS. Each has its particular strengths and weaknesses. CCDs are “potential well” devices. They collect almost all the incident light with good wide-band sensitivity. Photodiodes differ in that each pixel is rather like a miniature electric field device. The Hole Accumulation Diode has good dark current performance and charge transfer can be near noiseless. CMOS imagers use the commonest wholesale chip architecture with each pixel having its own feedback stabilised amplifier bussed onto q dedicated line array registers. One problem with this method is that line arrays do not see the whole picture contemporaneously. “Slantidicular” verticals can result as seen in the past with movement shot by CCD and shown on a CRT monitor, but this can be overcome with ingenuity.
Family Differences
Within these families are further divisions. Frame-transfer [FT] does not compromise on light sensitive area but must have a separate storage region and a mechanical shutter. Interline transfer [ILT] cuts light sensitive area by half and masks off the other half for storage. Thus FT risks increased noise and ILT risks a reduction in sensitivity. Pixel microlenses can improve ILT performance, but the substrate itself is liable to higher doping losses especially in blue. CMOS, being a voltage rather than current delivery device, particularly lends itself to on-chip analogue-to-digital conversion though clearly heat implications must be considered especially where camera head cooling airflow may be obstructed by prompters.
All modern sensors have many more pixels than demanded by straightforward Nyquist considerations. For example, there are several flavors of HD format to be accommodated. Spatial frequency aliasing will therefore be a problem if the pixel can “see” finer detail than the clock frequency can transport. This is likely to be more of a problem with ILT than FT because of the pixel’s smaller optical window. Think of it as clock frequency being the window frame whilst the glass pane represents the highest incident spatial frequency.
Layered bi-refringent materials are the classical solution to aliasing. They divide incident light rays into two equally bright paths with one processing round the other in space according to how the filter layers are oriented. This creates a constellation of dots that blur out at troublesome spatial frequencies. The action is lossless although the output light rays are orthogonally polarised which may prove an obstacle to 3D television. No doubt advances in digital signal processing can help, but the basic problem will not easily go away.
Ensuring Consistency
Good make-up artistry and wardrobe can filter out “wild card” issues that give rise to conflict between portraiture and exposure. There are also extended color gamuts which could be beneficial if applied to all receivers as well as adaptive techniques that modulate the gamma transfer law. With these last techniques it is important to see if the results match with the same subject shot by the same make of camera, and from different angles.
Conventional knee [or elbow] compression also fits highlight area into the available dynamic range. Highlight detail restoration and black press go some way to redressing the tendency of knee compression to bleach out. It is difficult, however, to keep hold of flare correction once the absolute brightness has been compressed and applied across RGB to retain white balance.
Using Sawtooth as a Tool for Consistency
Figure 6 (above) shows the SMPTE/ITU Rec. 709 gamma transfer law applied to a camera head sawtooth. This permits the engineer or technician to dispense with crossed greyscales in favour of a smooth continuum. When head sawtooth is exactly matched to the bench line-up of a camera it becomes a reference file of black, white, gamma transfer law and colour temperature. It is a standing record of the carefully controlled laboratory bench conditions that studio technicians and lighting crews are expected to match daily on each program ensuring consistency.
Figure 7 illustrates a variation of head sawtooth, still within the gamut of Rec. 709, to provide a thorough check of full scale saturation. However, real scenes, though colourful, are almost always much less saturated. To the eye it is pastel coloration that carries much of the fine detail and texture. Highly saturated and vibrant colours when compressed can lose “life” so a good test card pays attention to the fine rendition of the lighter shades and tones.

Colorimetry
Under tungsten-equivalent lighting the console faders are usually set around 70% [half-power] with the intensity controlled by position and throw. Lamp colour temperature [proportional to the fourth power of absolute temperature] then runs at about 2950 K with 600-800 lux being a comfortable ambient lighting level for acceptable depth of field.
A super-saturated gamut of millions of colours is less important than having good portraiture. In Figure 8 the fairest complexion is about 30% reflective. The matching greyscale in Figure 9 is intended to replicate this beach scene in all respects.
Greyscales can be simple and uncluttered and need not be multi-step provided that gamma is aligned using head sawtooth.
Camera Acceptance
When a camera channel is accepted into service, the greyscale should be lit to the actual studio standard, say 2950 K and not some value such as 3200 K that may be neither authentic nor practical. The head sawtooth is then carefully matched to the camera sensitivity, colour balance and preferred gamma transfer law. From now on the camera channels are consistent because a correctly lit chart matches the master reference files set up on the bench and reproduced in the sawtooth. Practical experience suggests a bench re-visit every 12 months to coincide with chart renewal is adequate.
Custom Matrixing
Even with two CDM28 charts (Figure 10) for verification, the ideal profile for the SMPTE/ITU Rec. 709 matrix is difficult to achieve with certain types of HD camera.
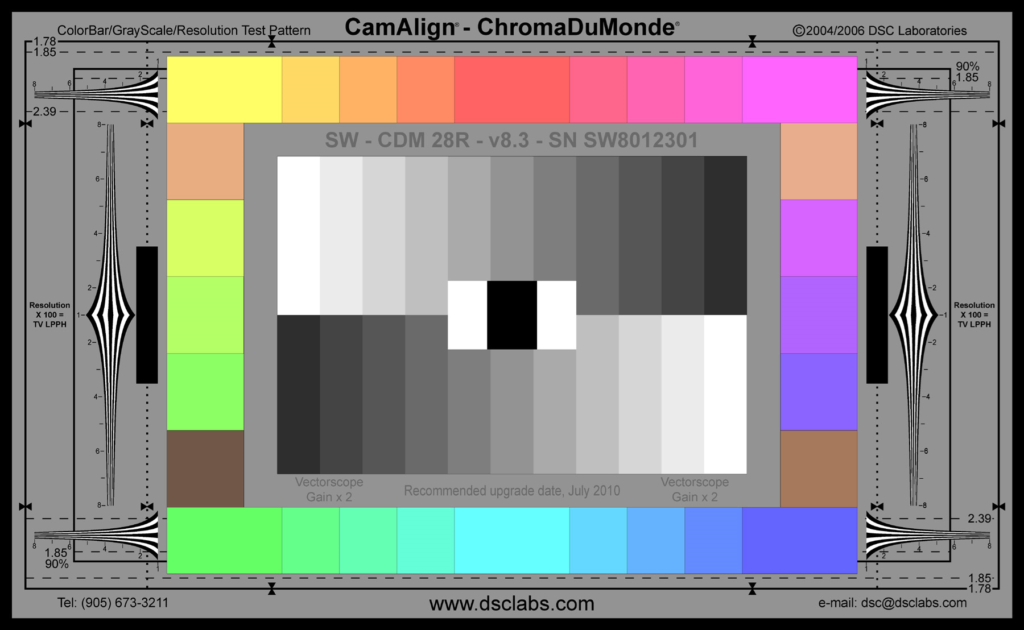
Creating a custom matrix with user matrices requires skill and perseverance with inevitable subjective and sometimes heated discussion! But the technique is not impossible.
Using a Vectorscope as the Primary Tool is not Ideal
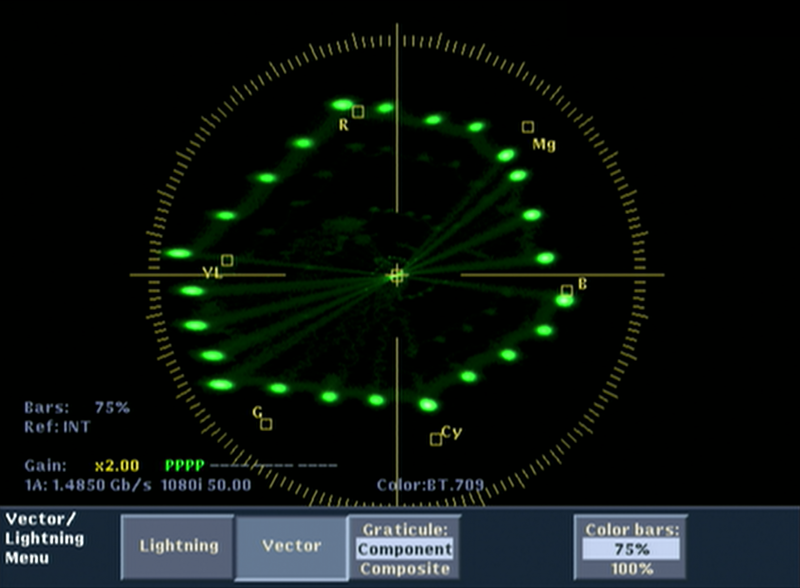
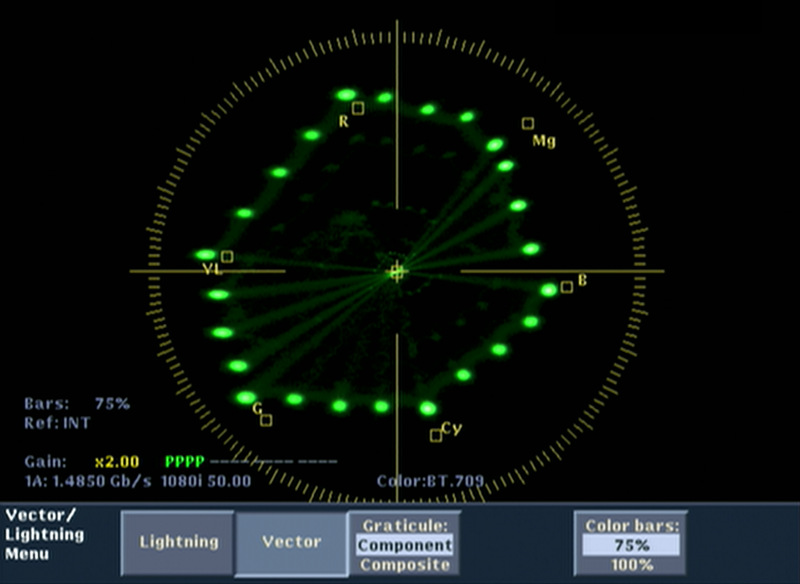
Figure 11 shows a rather skewed Red, Green and Blue taking response. Signal-to-noise performance is good, but there is scope for improvement in colorimetry.
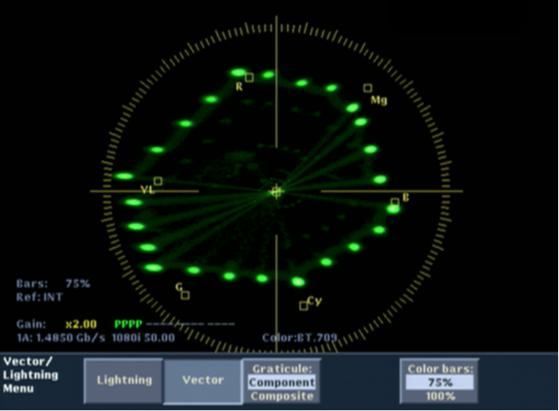
Correction based solely on vectorscope appraisal brings in its wake excessive noise, non-linearity and clipping. Tungsten lit surfaces can smear; fluorescent lit surfaces can show poor colour fidelity. So building a custom matrix using a vectorscope as the only measurement tool is not advisable.
Waveform Monitor and Luminance Linearity

It is important to make the distinction between linearity as seen on a waveform monitor and the linear nature of the YRGB matrix equations. Thanks to digital signal processing, the coefficients always sum to unity in the luminance matrix equation and the smaller the individual coefficients are, the cleaner the picture is. David Corley stresses the primacy of luminance linearity in each of RGB. Good clean undistorted vector dots and picture appraisal complete the “three-legged stool” approach. The CDM28 chart lends itself to this three-fold technique looking at one small part of the colour space at a time. At each measurement station there are five colours – a primary colour, a neighbouring secondary colour and three intermediary colours that sit between the two. There are a total of six sectors.
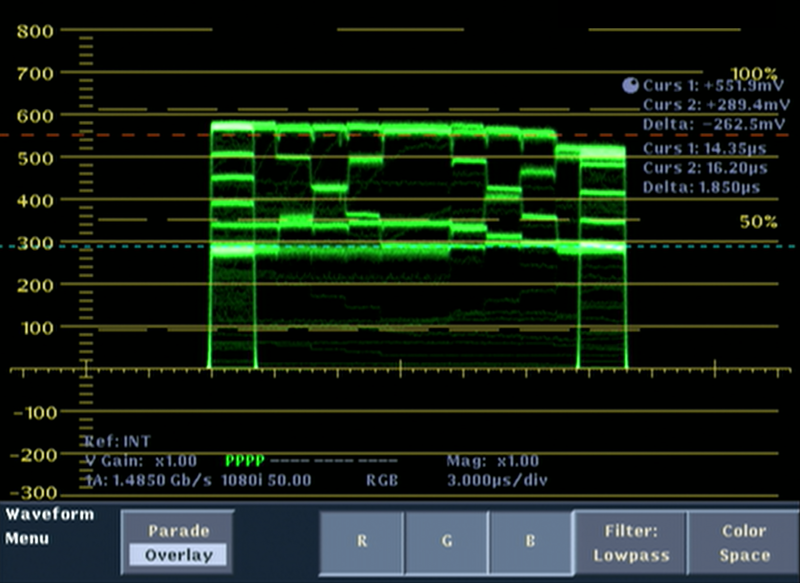
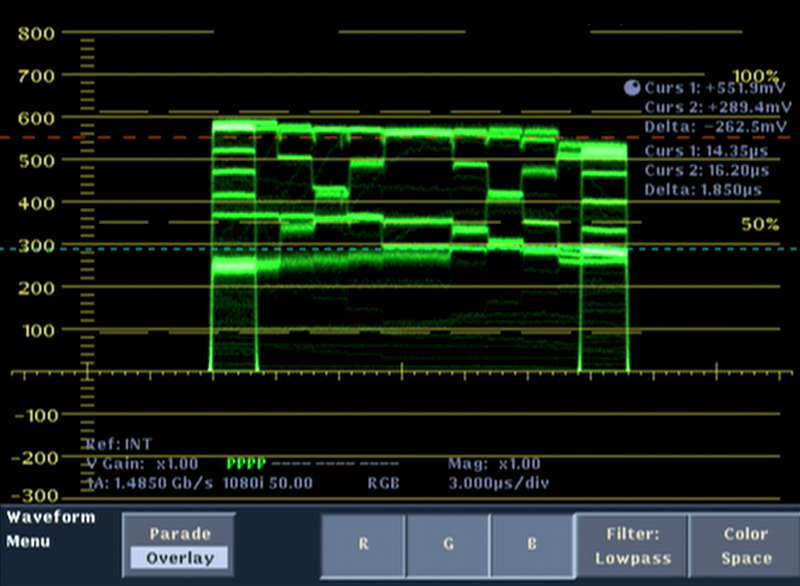
If the five colour chips for each of the six sectors given above are displayed at line rate, then the waveform monitor will show two horizontal lines – in this instance one at 551 mV, the other at 289 mV – and a third which steps between the two.
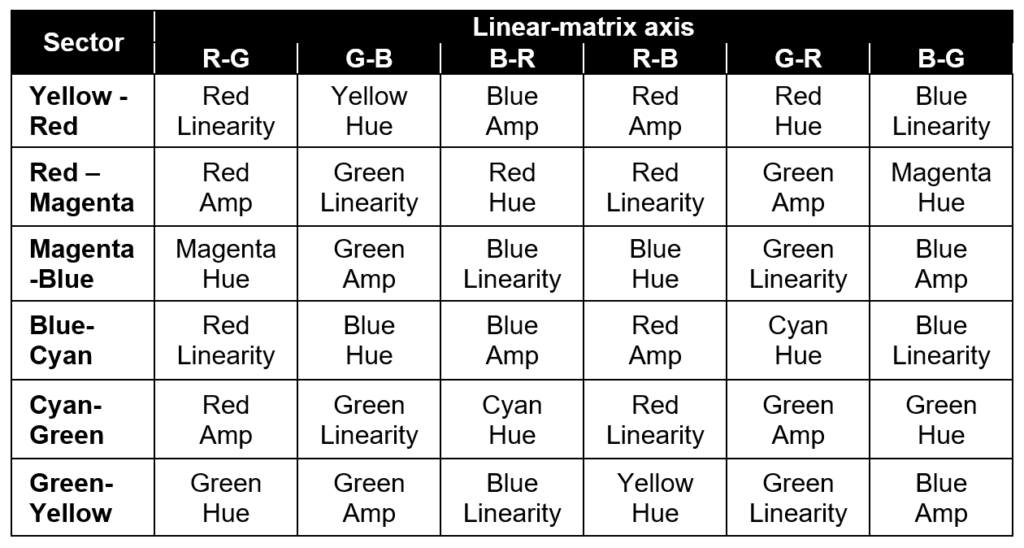
View the two linear [i.e. un-stepped] channels for any given sector in RGB overlay on a waveform monitor and the optimisation process can begin. One of the six axes of the linear-matrix will change the amplitude of one colour channel, and a second will linearise it. The third and fourth axes provide the same functions for the other linear channel. The fifth and sixth axes change the hue of the primary and secondary colours; however this introduces coefficients that have a negative impact once the results are averaged so generally little adjustment is made. (Table 1)
First Compromise Matrix
This technique effectively involves making six separate matrices, one for each sector. Averaging these results then creates a ‘first compromise’ matrix. The results from all six sectors are tabulated and shown in Table 2. [These values have been disguised and are not intended to be representative of any camera].
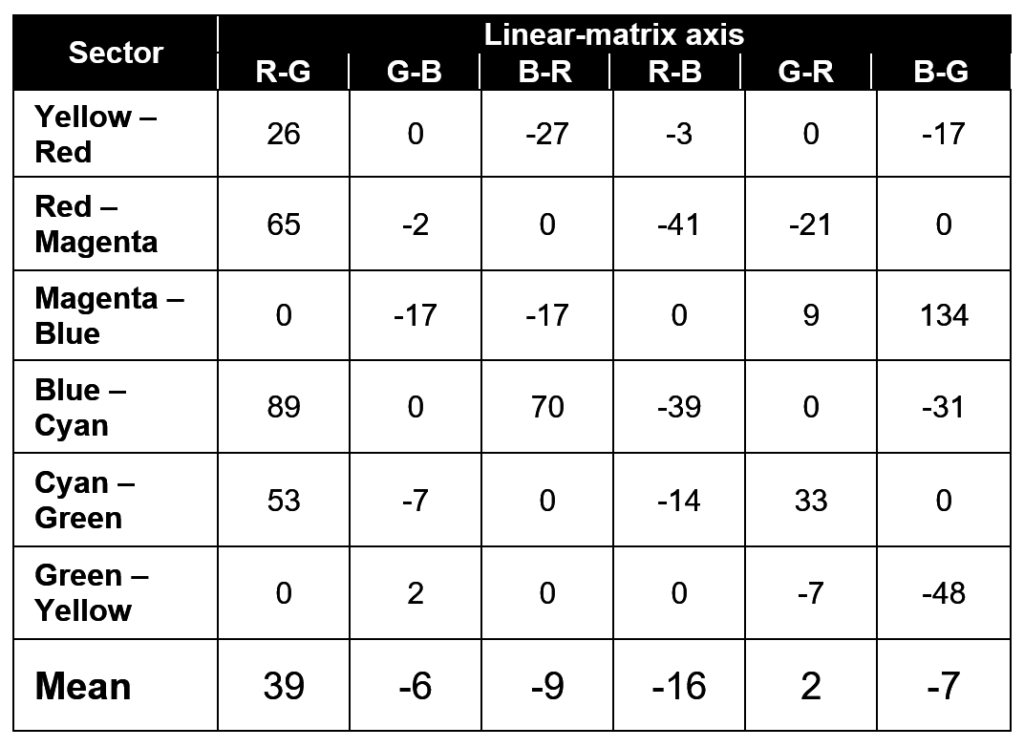
Some of these coefficients are rather large, most notably B-G for Magenta – Blue. Large weightings like this are required to achieve the best results for individual sectors, but once averaged they distort the coefficient for B-G for the other sectors too much.
Coefficient Capping
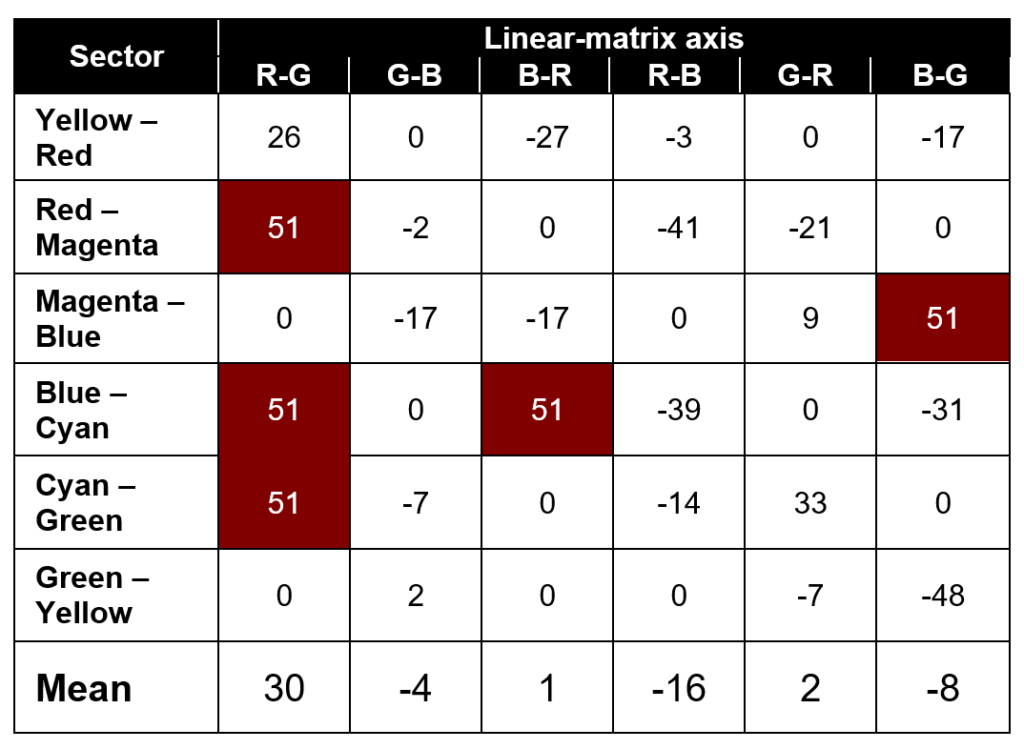
A coefficient of “68” is where abnormalities tend to start occurring on this example. Trial and error proved that a capping value of “51” gave the best results overall. This leaves some leeway for day-to-day trimming of particular colours without undue distortion. Shown in Table 3 are the new results after the artificial cap has been applied. This is done with regard to waveform monitor, vectorscope, signal-to-noise and picture appreciation.
Optimised Matrix
The coefficients in Table 3 now provide a compromise for the color-space at large, but they are not necessarily the best for skin tones. One final adjustment to B-G is made on their behalf to complete the optimization process. (Table 4)

To summarise the process, compare Figures 12-15 taking into account RGB linearity, signal-to-noise, vectorscope phase and “dot” irregularity. Separate noise meter tests are preferable. A slow rotational wipe set up on the vision switcher permits close matching of several cameras.
Harlequin Chart
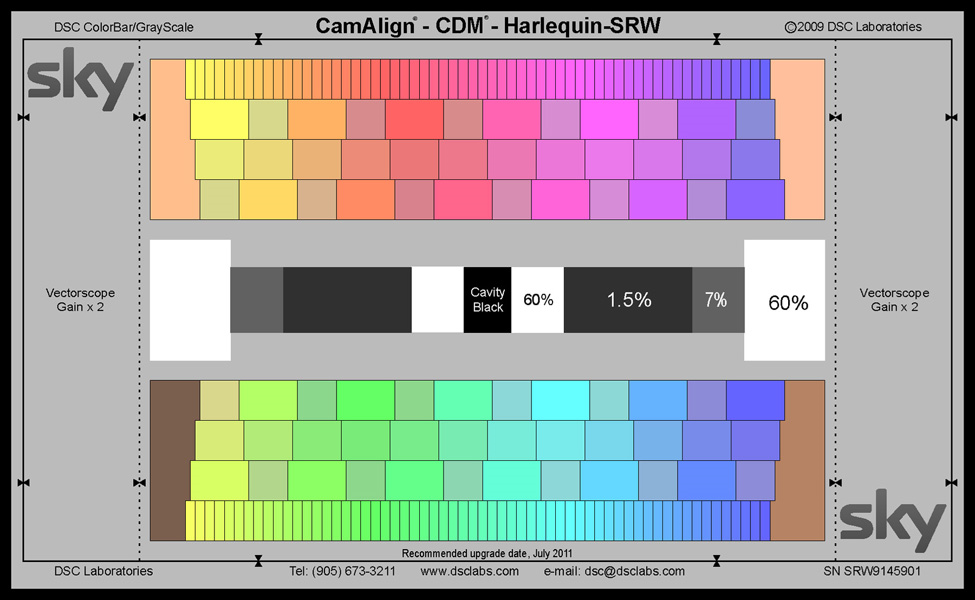
The “Harlequin” test chart (Figure 16) incorporates all of the above features when used in conjunction with camera head sawtooth as a reference file. Its design assists the operator to position the chart without flare or shading. The colours appear as a vectorscope wheel and spokes and their disposition is amenable to line-rate display on a waveform monitor. The four skin tones sit optimally in the studio dynamic range.
Outside the Studio
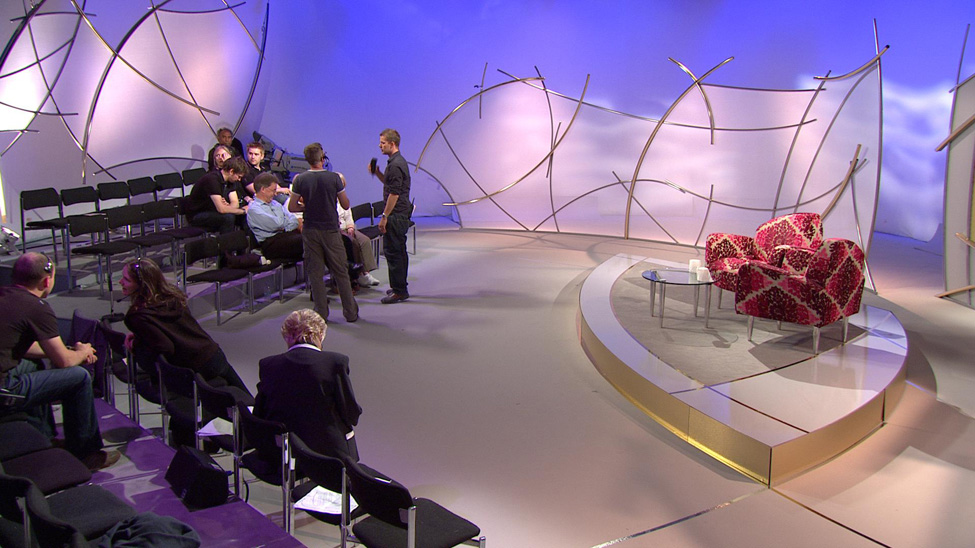
However some outside broadcast situations present extremes of dynamic range that are not so susceptible to control. This is where emergent technologies such as adaptive gamma can deal with two or more planes of dynamic range and colour temperature. In both these scenes, a 60% reflectance white is used to favour the skin tones, but adaptive gamma handles the snow scene to good advantage in light and shade.

Conclusion
This paper recognises that while everyone involved in image reproduction is looking for high-quality, the definition of high-quality can vary considerably. The aim of the motion picture community is to achieve the widest possible dynamic range and colour gamut. TV producers, however, meet other constraints. Even if picture detail or visuals cannot be fully reproduced at the point of final delivery, the bandwidth/bitrate of the whole delivery “pipeline” can have the cost benefit of more channels at a pre-defined quality. This apparent shift from engineering-based single solution towards customer choice has occurred over the past 30 years with many contributing factors. At present Rec. 709, 1080p [“3-G”], 1080i and 720p represent much of the state of the art and have been discussed. There is undoubtedly more to follow, especially in the field of cameras, display devices, digital signal processing, broadcast computing, graphics and server technology. New standards will inevitably arise yet the principles discussed here should still be of assistance when all these future developments come to pass, especially when bandwidth is at a premium.
This paper is reproduced with kind permission of SMPTE.

